
Designing a self-tuning I/O environment in HPC
Download in PDF
I/O Challenges in HPC
In High-Performance Computing (HPC) data movements are one of the biggest challenges. Indeed, large computation is necessarily leading to large datasets. Current HPC workflows favor a feed-forward way of launching programs, loading their dataset, and then storing the result in persistent storage for later post-processing. This is done by separate jobs without any form of collaboration. Moreover, the I/O backend is so critical that it generally runs separated from the machine in a service island, being dimensioned for the whole system. What if the I/O subsystem and the application started collaborating to perform better? This is the question ADMIRE tries to respond to. This EUROHPC project has taken the ambitious goal of experimenting with a holistic I/O management approach. In the project’s framework, it translates into a feedback loop and careful job and service reconfiguration to handle I/O resources globally in the computing center. This should translate to a lower dependency on the I/O backend reconfiguring nodes to act as an ad-hoc file-system — reducing the need for large and expensive I/O backplanes. In this context, being able to precisely describe what is taking place on the system is crucial, and to this matter, a new real-time monitoring system was developed by project partners.
Always on Profiling
ADMIRE intends to develop an always-on monitoring infrastructure to enable malleable jobs. Such undertaking leads to strong constraints on the measurement system which has to provide both real-time and goal feedback on all layers of a supercomputer. These measurements are to be used to guide scheduling decisions and dynamic I/O reconfiguration during job allocation.
Data-Pipeline
infrastructure, storing data in Prometheus
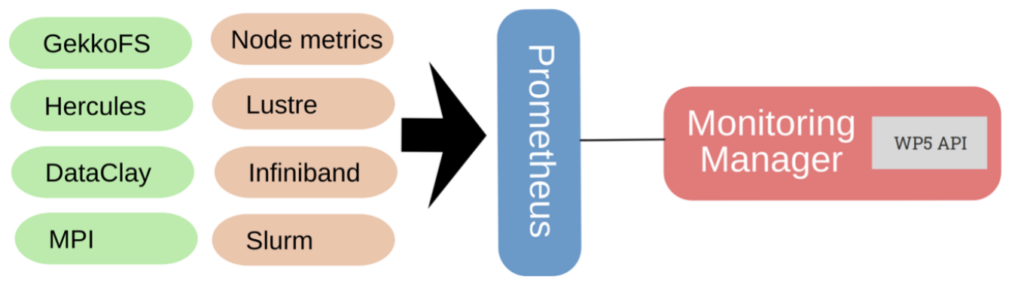
To bridge with existing technologies in the cloud and more generally in IT, we retained Prometheus as our performance database, time-series being the metric of choice to guide ADMIRE’s components’ decision. Our goal is then to provide a whole system’s view in the Prometheus performance database. However, due to the important number of data sources and their evolving number (processes launched in jobs) we had to develop a specifically tailored aggregating push gateway for Prometheus: the tau_metric_proxy.
Aggregating Push-Gateway
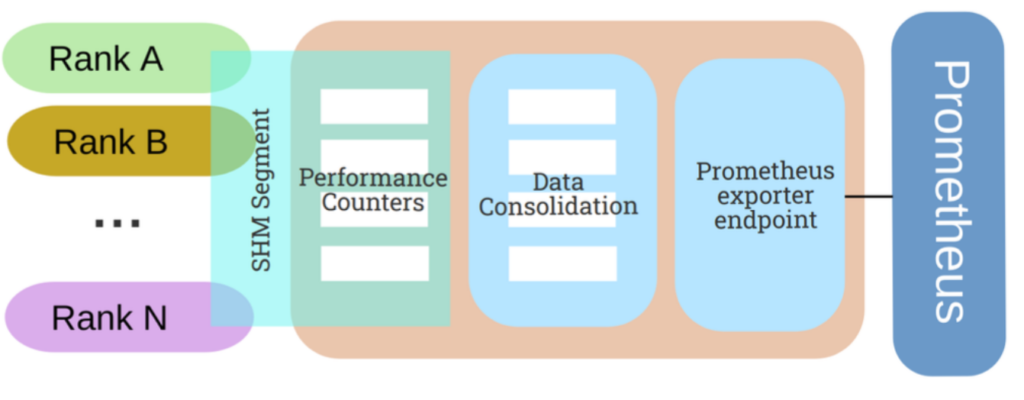
Thanks to this push gateway specifically designed for the project, we can locally aggregate performance data on each node in real time. Prometheus then has to collect only a reduced amount of data from a fixed number of data sources. These developments were combined with the design of specialized exporters for MPI, I/O, and at the node-level. All these data can be fed into the database to enable close to real-time global system view up to the MPI call level. This is an unprecedented level of verbosity that we intend to achieve machine-wide while remaining compatible with Exascale constraints.
Tree-Based Overlay Network
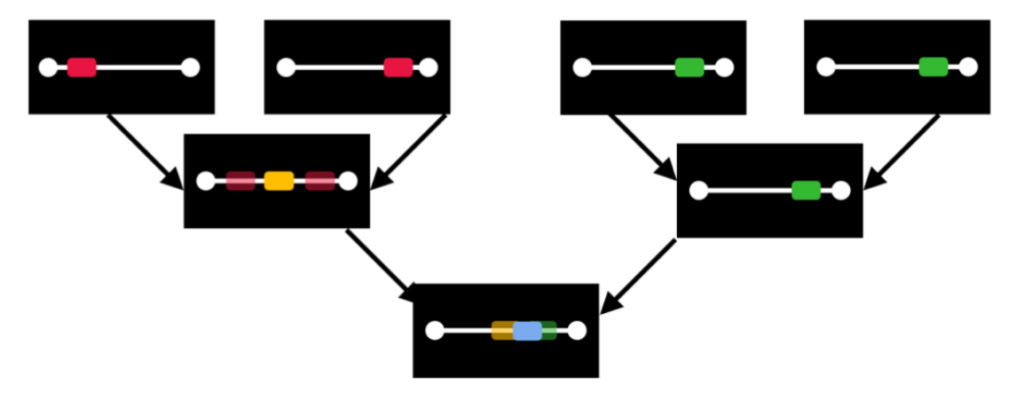
Our key approach to maintaining a manageable level of performance data is to combine high-frequency measurements spatially to limit the resulting number of data points. As of today, ADMIRE can collect up to 3000 metrics in real-time on each node. Prometheus aggregates them locally every 5 seconds. Besides, to provide a global view we rely on the LIMITLESS monitoring and aggregation tool with relies on a Tree-Based Overlay Network (TBON), see Fig III, to generate spatially reduced performance data over time for the whole system. Thanks to this multi-tiered approach, we can then maintain high-frequency spatialized performance blaming while preventing a combinatorial explosion when tracking the global system’s state. As a result, we can feed at high-frequency a Prometheus instance without connecting to N individual nodes — dodging a scalability challenge.
The Way Ahead…
The project features a diverse set of representative HPC applications. In a fully-integrated co-design process we intend to validate our experiments on the ADMIRE I/O subsystem in real-world conditions on true applications. We are currently entering our integration phase where all the specifically developed components are being bridged together. On the monitoring side, we have a dedicated deployment helper setting-up the whole measurements infrastructure in user-space and we will leverage it in conjunction with all the other ADMIRE components.
Captured Metrics
ADMIRE’s monitoring infrastructure is capable of collecting a wide range of metrics today and we constantly keep improving the measurement layer to provide a detailed view of the system.
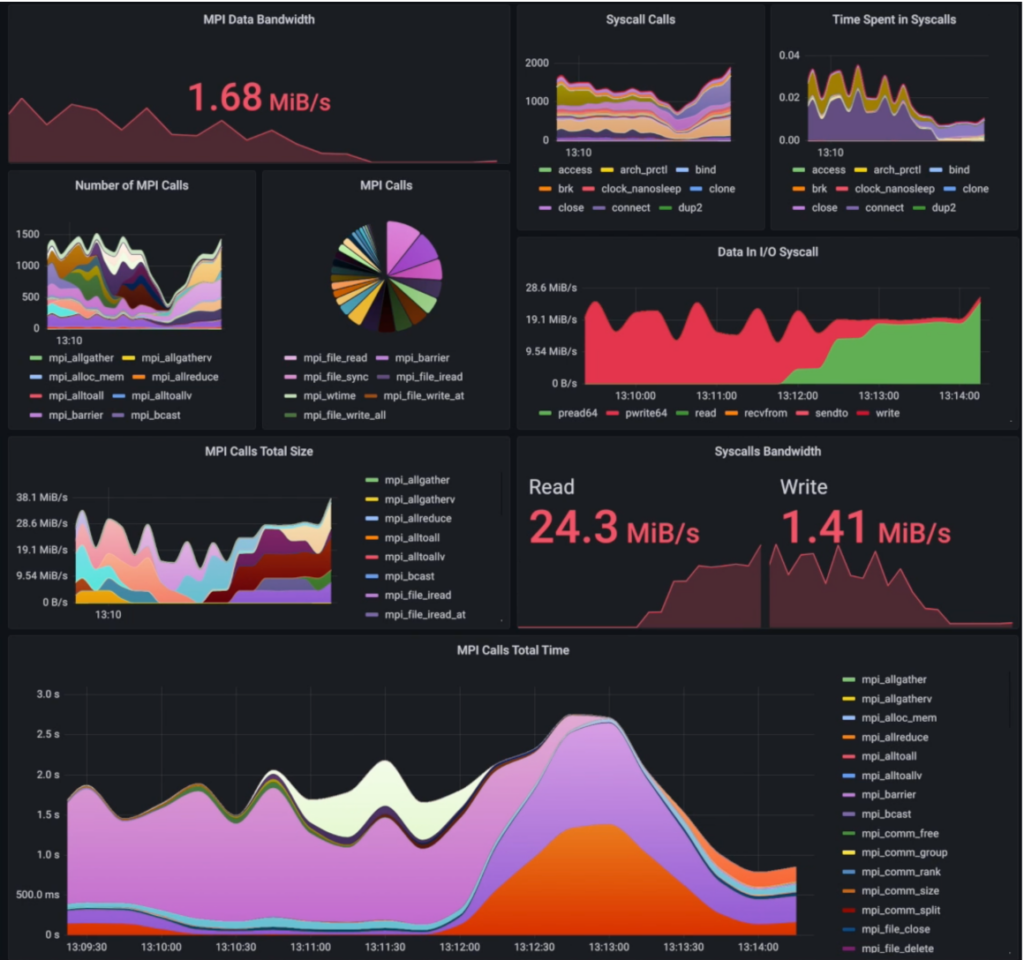
Message Passing Interface
We capture all MPI calls and their duration and respective sizes in an always-on fashion. It means in ADMIRE’s configuration you can see MPI calls rate and throughput in real-time on the whole system.
I/O Monitoring
Thanks to a close collaboration with the I/O backend and dedicated instrumentation layers, ADMIRE can non-intrusively characterize I/O traffic. To do so, we instrumented both common interfaces (POSIX) and specialized (Ad-Hoc, MPI) I/O interfaces to track both the bandwidth and origin of the data traffic.
System Monitoring
System monitoring is done by the LIMITLESS daemons which precisely track node-level data with optimized data-cropping algorithms to only account for representative state changes. Thanks to this component all parameters relative to nodes’ health and global resource usage are tracked in real-time thanks to the reduction Tree-Based Overlay Network (TBON).
287 thoughts on “Towards I/O monitoring at scale”
Comments are closed.