Performance monitoring and observation is a requirement in the complex IT systems we are building nowaday. Exascale systems are digital factories operating with millions of cores and discrete components. As any factory, these systems are instrumented and monitored.
Performance observation is facing three main challenges:
- Operating at scale, many solutions, based on Nagios and even more modern telemetric clients (telegraph, collectd) perform efficiently up to a threshold before finally stumbling over the harsh reality of the 1:N pattern. Fundamentally this is a topological issue with too many nodes trying to establish a connection to a single node.
- Operating in real-time, Monitoring is not exactly a synonym of Profiling. Profiles tend to be built post-mortem. As an example, the Darshan tool is great at producing a detailed I/O profile of an application, but only after the application has terminated. The ability to provide live observations remains a temporal limitation, due to the difficulty to summarize in time the right volume of information and to display exploitable results.
- Co-operating, this last point is not a conceptual limitation but an operational one. It has been observed that I/O solutions tend to overlook information related to the compute nodes, and that monitoring solutions focused on CPU are just ignoring the very notion of I/O.
Operating at scale
ADMIRE monitoring infrastructure is using Prometheus as a central point of information. Prometheus is not scaling to the number of nodes we are targeting in EuroHPC. Here comes LimitLESS from UC3M.
ADMIRE has its own monitoring client in charge of extracting key metrics out of the system. The client is based on the well known TAU performance software. To ensure the scalability of the monitoring we rely on LimitLESS. A low-overhead LimitLESS client is deployed on every node, and it ships the performance information to one node based on a pre-defined topology. This way a logical binary tree is mapped over the compute nodes space, each node is concentrating information from two children. Ultimately this allows to limit the number of Prometheus clients. For fault tolerance consideration, we actually generate 8 different sub-trees to cover the full system. One of the root nodes would failed, we would still have detailed insight on ⅞ of the systems.
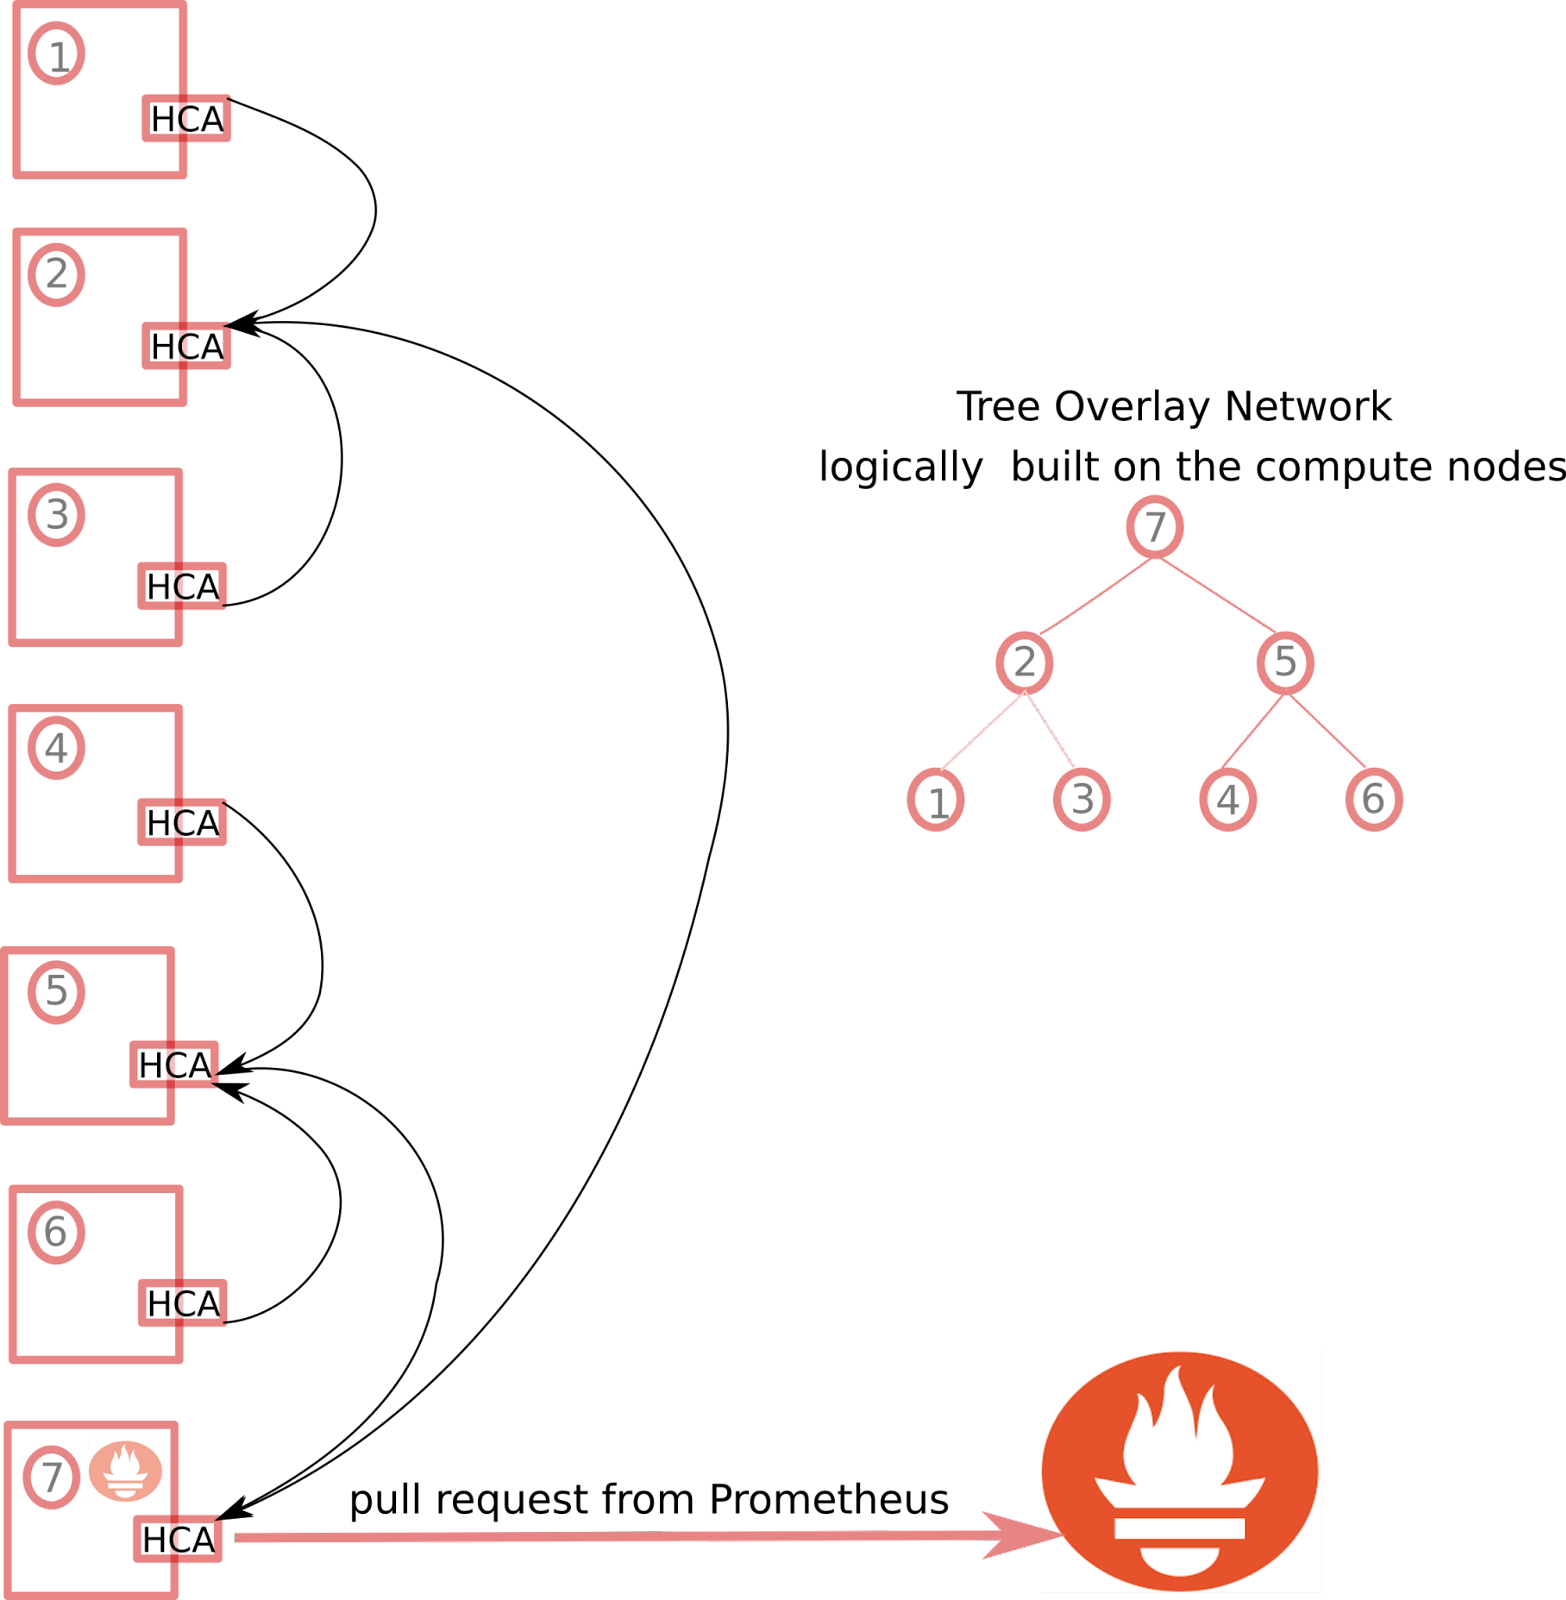
Tree overlay Network: monitoring without bottleneck
Operating in real-time
Operating in real-time is a trade-off brought by the volume of data to process. Traditional solutions such as Darshan store information and display it after completion of the job, or they present I/O load as an aggregated value.
In ADMIRE we address the real-time issue by making the difference between data and information. We filter out data with limited information content. As a result we end-up with BarrelEye, a Lustre extension, displaying live the volume of read/write and IOPS on a per job basis. Thus, we can assess at any given point in time the fraction of the load generated by a specific job. Our second take on the problem is leveraging the limitLESS component deployed at Scale. Instead of shipping data every time step, the component ships data if and only if metrics have changed. Reader can make the parallel with the straightforward Run Length Encoding image compression scheme (RLE). This discrete compression algorithm is simplistic, a more sophisticated way is to bet on compression. Lossy compression is a good candidate: algorithms are fast, the importance of the last digit for performance monitoring is low. Lossy compression allows a high update rate for the performance metrics without overloading the system. Depending on the load we may receive slightly blurry images of the performance but always at 24 frames per sec!
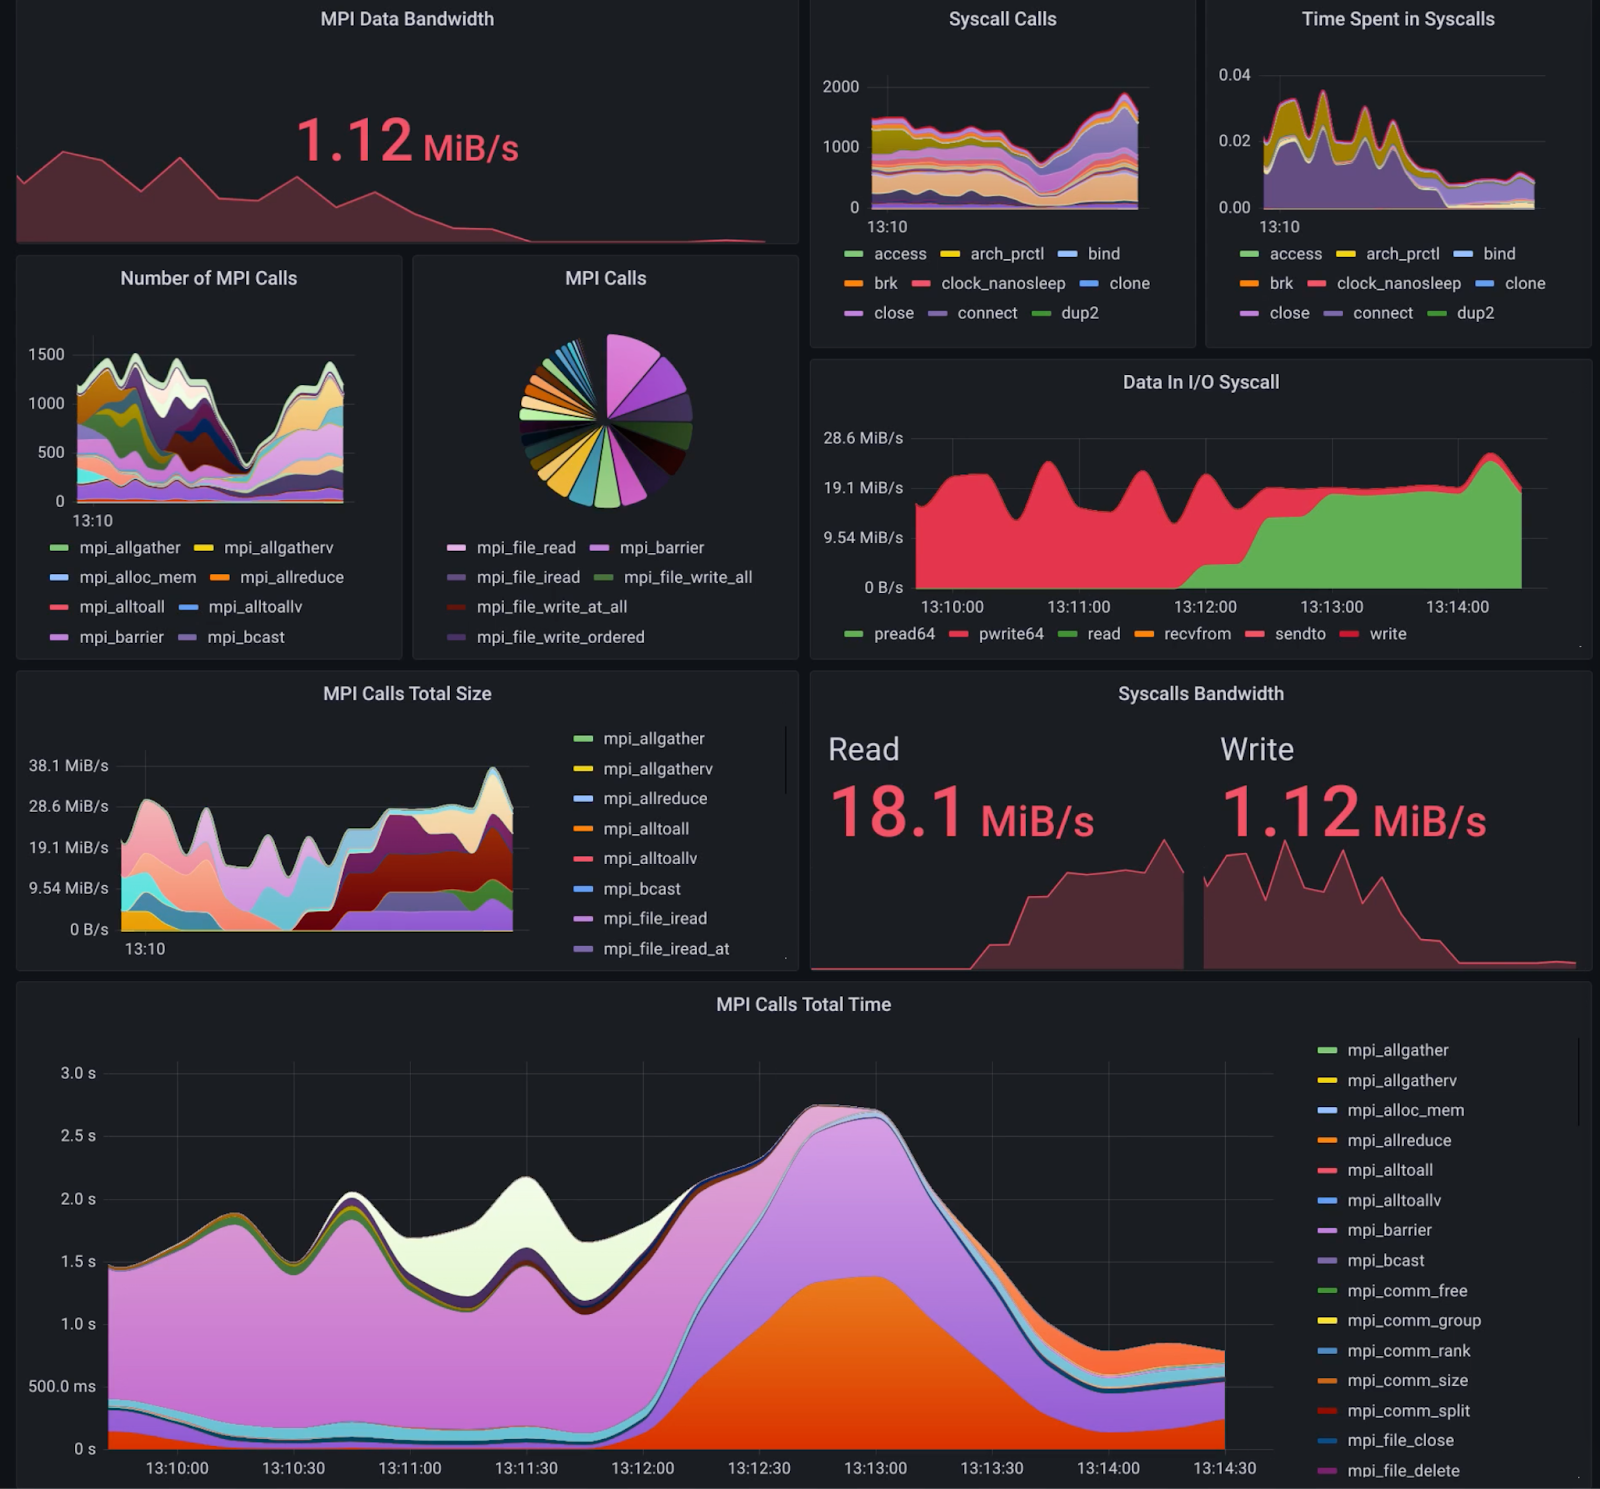
Performance Dashboard for ADMIRE: update rate every 5 seconds!
Co-operating
Two key performance rankings exist in HPC, the TOP500 ranking HPC systems based on their CPU capabilities, and the most recent IO500 focused exclusively on I/O. Quite interestingly both are mutually blind about the existence of its sibling. The path followed by ADMIRE is slightly different. The performance daemon deployed on every compute node is also collecting CPU and Memory information and actually hundreds of other metrics. The corollary of having I/O and CPU information in the same database is that we can draw correlation. Breaking silos is a nice step toward interoperability. But the definitive operational difference is the existence of an API to question the database through RPC and PromQL requests.
ADMIRE develops a monitoring framework which can be automatically questioned about either the status of the I/O, or the computational stress at the job or node level and in real time. This monitoring technology is an enabler for the core of ADMIRE: an intelligent scheduler able to take runtime decisions to optimize the efficiency of the system, which is indeed closing the loop from observation to action!
14 thoughts on “Closing the loop: from Observation to Action”
Comments are closed.